3Q21 Earnings

This is why we all own it.  Clean quarter that is demonstrative of the power of the assets.  All eyes on capital return / allocation policy from here…

Summary

10-Q

Call tomorrow 8:30 eastern, 7:30 central

Edit: Below is what I wrote to a contact after the call. What was your reaction?

“I think they took a well deserved victory lap on water. Margins are turning up and that business does need active management. Using bid/ask as an excuse for keeping $400MM in cash on the sheet seems like a stretch.”

2Q21 Earnings

Texas Pacific Land Corporation Announces Second Quarter Results :: Texas Pacific Land Corporation (TPL)

Production pretty flat but prices up. $330MM in cash on the sheet.

Our total revenues increased $38.6 million for the second quarter of 2021 compared to the same period of 2020, largely driven by the $37.7 million increase in oil and gas royalty revenue. Our share of production was approximately 16.4 thousand barrels of oil equivalent (“Boe”) per day for the second quarter of 2021 compared to 15.7 thousand Boe per day for the same period of 2020. The average realized price was $40.83 per Boe for the second quarter of 2021, compared to $15.02 per Boe for the comparable period of 2020. Water sales and produced water royalties increased $4.1 million and $2.3 million, respectively, for the second quarter of 2021 compared to the second quarter of 2020. The increase in water sales for the second quarter of 2021 compared to the same period of 2020 is principally due to a 70.8% increase in the number of barrels of sourced and treated water sold. These increases in revenue were partially offset by easements and other surface-related income, which decreased $2.7 million for the second quarter of 2021 compared to the same period of 2020. These revenue streams are directly impacted by development and operating decisions in the Permian Basin made by our customers and commodity prices, among other factors.

1Q21 Earnings

10-Q

Press Release

I was coaching first base when I heard my phone whistle its notifcation for the earnings press release.  During a pitching change I quickly skimmed the document.  When the batter stepped in I got so distracted thinking about the $20MM buyback number that I sent my runner to steal 2nd with a runner already on that bag.  Thankfully the third base coach, who probably owns BSM, saw my folly and called his runner.  Some bad thows later and it all ended up ok.  But $20MM?

My expectations for the quarter were pretty light due to the tough winter conditions and pandemic hangover but I expected more from the buy back.  Is this management telling us the price is too high?

The quarter ended with $310MM (~$40/share) in cash on the balance sheet.  Do I get a dividend?  M&A inbound?

Water was challenging.  What’s the plan there?


4Q20 and 2020 Earnings

10-K & Press Release

  • Share buybacks back! at discretion of board
  •  7,756,156 shares out as of 1/31/21
  • Quarterly dividends going forward. Starting at $2.75/share. 1% regular div yield
  • $44.8mm net income; $5.77/share
  • Income down $24.3mm vs $4Q19. Primary driver of that was $20.4mm reduction in land sales
  • First month WTI futures were $35.82, $45.10, and $48.46 to close Oct, Nov, and Dec 20 respectively. Compare with 2019 at $54.15, $55.41, and $61.12 over the same three months.
  • Expenses $6.1mm lower Q4 to Q4
  • Water top line down, primarily on price, but so are expenses. Will be interesting to see where water goes from here given consolidation and the long term thinking touted by the E&Ps
  • Largest customer OXY is slowly de-levering and has found some stable ground
  • Search for new compensation consultant being undertaken by comp committee
  • Are the independent directors not paid enough at $24k a piece?
  • $281mm in cash on the balance sheet. Will be ~$250mm after March dividend payment. $250mm = 2.9% of market cap
  • BOE:  2019 = 13,700.  2020 = 16,200 
  • DUC:  2019 = 486.  2020 = 531


3Q20 Earnings

https://www.sec.gov/Archives/edgar/data/97517/000009751720000051/exhibit991q32020earnin.htm

Expenses moving down.

What was sold?

The Trust recognized land sales revenue of $11.5 million for the third quarter ended September 30, 2020 and $4.6 million for the comparable period of 2019.

$46mm in net income + $4mm in depreciation = $50mm more cash on the balance sheet.  Add that to the $258mm from the end of Q2 to get $308mm or ~$40/share or 8.5% of market cap.

Update:  The actual cash number is $316mm.


2Q

Rough one as expected. That said, it’s hard not to be impressed by volumes.  Also, six month top line vs last year looks decent if you like to see the bright side of things.  Adjust for land sales, revenue for the first six months of 2020 was $149.5mm.  First six months of 2019 was $170.2mm adjusted.  Maybe we call that a win given the pandemic backdrop?

https://www.tpltrust.com/investors/news-events/press-releases/detail/106/texas-pacific-land-trust-announces-second-quarter-2020

Still on track for conversion by the end of this quarter.

As previously announced on March 23, 2020, our Trustees approved a plan to reorganize the Trust from its current structure to a corporation formed under the laws of the State of Delaware. We continue to progress towards the conversion. On June 15, 2020, the Trust announced the new corporation will be named Texas Pacific Land Corporation (“TPL Corp”) and the persons selected to serve as directors on the Board of Directors of TPL Corp. Additionally, a draft registration statement on Form 10 has been submitted to the Securities and Exchange Commission for review, on a non-public basis. It is currently anticipated that the corporate reorganization will be effective by the end of the third quarter of 2020, barring any unforeseen impacts of the COVID-19 pandemic or other developments, which could potentially extend this timeframe.


Margin Watch

2019 margin analysis

My way of backing into water.  Back non-water revenue out of EBITDA.  Add “old expenses” and legal (big $$$$) to the adjusted EBITDA number to get a ballpark water income.  Look at water income relative to water top line to observe expenses and margins.

Seperately we can look at margin without asset sales.

Both margins are contracting.

It is understood that one has to spend money to make money, expecially in the water business, but I’d love more information on the end game.


3Q 10-Q

Filing

Some observations in no particular order:

  • “During the nine months ended September 30, 2019, we purchased and retired 6,258 Sub-shares. During the nine months ended September 30, 2018, we purchased and retired 39,768 Sub-shares.”
  • DUC wells now 424 vs 369 at the end of Q2.  15% jump.  Someone has been busy.
  • $250MM in cash on the balance sheet
  • $87MM in PP&E.  34% growth YTD
  • Water has made $65MM top line YTD.  Up 37% from same period last year.  Top line is generally supposed to grow faster than PP&E, right?
  • $24.7MM in operating expenses during the quarter.  2.4x vs same quarter last year
  • “For the nine months ended September 30, 2019, the Trust sold approximately 21,986 acres (13,180 acres in Loving County, 5,675 acres in Culberson County, 1,651 acres in Hudspeth County, 843 acres in Reeves County, 636 acres in Midland County and approximately 1 acre in Glasscock County) of land in Texas for an aggregate sales price of approximately $113.0 million, with an average of approximately $5,141 per acre.”
  • “For the nine months ended September 30, 2019, the trust acquired approximately 21,671 acres (Culberson, Glasscock, Loving and Reeves Counties) of land in Texas for an aggregate purchase price of approximately $74.4 million, with an average of approximately $3,434 per acre.”
  • I wish we had more details on rationale and benefits of the land swap above.  Flat in acres, took out some $$ (great), but is ending acreage accretive to the grand plan?  How so?
  • EBITDA language from the press release did not carry over to the Q
  • “Legal and professional fees were $5.6 million for the three months ended September 30, 2019 compared to $0.6 million for the comparable period of 2018. The increase in legal and professional fees for the three months ended September 30, 2019 compared to 2018 is principally due to approximately $4.9 million of legal and professional fees related to the proxy contest to elect a new Trustee, the entry into and payments made under the settlement agreement dated July 30, 2019 and the conversion exploration committee as disclosed in the Trust’s Current Report on Form 8-K filed with the SEC on July 30, 2019. We anticipate receiving a partial reimbursement of these legal and professional fees under coverage provided by our director and officer insurance policy. The amount of the reimbursement has not yet been determined.”
  • I’m surprised the D&O underwriter wrote a policy given the Trust structure of the company and it’s (now abused) governance limitations.  I’m guessing they regret it
  • “Salaries and related employee expenses were $8.5 million for the three months ended September 30, 2019 compared to $4.1 million for the comparable period of 2018. The increase in salaries and related employee expenses is directly related to the increase in the number of employees from 58 employees as of September 30, 2018 to 89 as of September 30, 2019 and additional contract labor expenses for the three months ended September 30, 2019 compared to the same period of 2018.”
  • “Texas Pacific is not involved in any material pending legal proceedings.”  ??


3Q Earnings and Conversion Committee Update

Earnings press release

Impressive top line growth.  I can’t help but see that EBITDA (newly included by TPL in releases) is pretty much equal to revenues from royalties, land sales, and easements.  It appears as if all profits from water are being eaten by legal fees and comp.  Estimated water margins appear to have stabilized near 50%.  The sheet below isn’t perfect but it’s likely directionally right.  Margins are being squeezed by expenses.

q3 margin analysis updated

Simple margins tell you this as well.

simple margins q319

Can’t wait until legal fees are in the rear view mirror.

D&A increasing.

I’m not operating the business but my guess is that there are some aspects that can be tightened up.  We shall see.

That all being said, $7.74/share x 4 = $31/share annualized.  $569 / $31 = 18 P/E.  Low to historic multiples.   We’re looking at a $775 price at a 25x multiple which is more consistent with historical valuations.


Conversion Committe update

The Committee has continued to meet with its advisors, including Credit Suisse, which is assisting the Trust and the Committee in developing its recommendation to the Trustees. The Committee has met 5 times, both in person and over the phone, since its inception, and deliberations to date have been productive and informative. Although its deliberations are confidential, the Committee will continue to provide monthly progress reports to shareholders as required by its Charter before issuing a final recommendation to the Trustees.

Was hoping for a bit more progress than that!  So 2 meetings in October?

2Q Earnings

Full Press Release

SEC version

2q snapshot

$49,586 / $87,310 = 56.8% Q219 margin

$52,503 / $73,844 = 71.1% Q218 margin

Revenue up 18.4%

Net income down 5.6%

Tough quarter.  Back out the $4.9MM in land sales and it looks even worse.

The word expense is only used in the release twice and the context there was income tax expense.

Share count unchanged on the quarter at 7,756,156.

Time for change.


Q is Out

SEC Filing

Notes (no guarantee that any of this is right):

  • “Simple” balance sheets and ISs are a thing of the tax now as we have tax escrow, depreciated PP&E, and acquisition carrying values to navigate
  • Balance sheet at $405MM is 5.7x that of a year ago.  New property goes on BS at cost.  Old stuff has no accounting value.  Quickly getting on WB’s radar for its excellent price to book
  • Rude and crude water margin calculator shows margin expansion for the quarter. Again, this assumes all expense increases after ’16 are water related.  Certainly not perfect
  • I calculate the “non-sale” (no sale income included) EBTDA to be $73MM.  $73MM taxed at 20% = $58.4MM or $234MM/year.  20x = $4.67B.  30x = $7B.  Current mkt cap is $6.13B.  Implied multiple = 26x.  Again, very back of the envelope
  • The statement of cashflows seems kinda useless now as one has to immediately back out asset sales from CFO
  • Repurchases down 35% from first quarter last year.  Divs up 47%.  I don’t want dividends; I want my % stake increased
  • Water PP&E went from $62.9MM at year end to $71.6MM.  A total increase of $8.7MM.   Total buybacks in the quarter were $4.3MM
  • Fixed asset purchases of $9.3MM in Q1 (assuming mostly water equipment) are pretty close to my calculated $11MM in water EBTDA.  Fixed asset purchases don’t hit expense line.  How long does this last?  How long are the useful lives of water assets?
  • Legal and professional fees increased 175.6% to $1.8 million for the three months ended March 31, 2019 from $0.6 million for the comparable period of 2018. The increase in legal and professional fees for the three months ended March 31, 2019 compared to 2018 is principally due to increased legal and professional fees related to land transactions, new water agreements and proxy fees.”
    • Can we get a more granular breakout?
  • Compensation up 2.5x YoY

q1 analysis


$83MM of the $100MM

Looks like I was beat to the punch on this topic.  Here is the same question in the comments thread on the SA earnings release report.


For example, the Trust has redeployed approximately $83 million of the $100 million of the sale proceeds in a tax-free 1031 Exchange, creating 53,000 contiguous acres in the core of the Delaware Basin1, including highly strategic acreage on the Texas-New Mexico border. This position is leased by blue chip E&P operators with large capital development budgets and best-in-class safety and environmental implementation.

If $83MM has already been spent under 1031, does the reported gain get backed out of EPS next quarter?  If so, shouldn’t that have been reported in the press release?   There probably is a regulatory/accounting reason for reporting it in the manner that it was.  Can anyone help clear this up?


Earnings Analysis; Q1-19 vs Q1-18

The rows below should be pretty self explanatory.  Ultimately I wanted to get to earnings adjusted for asset sales.  “Operating” after tax EPS is calculated to be $7.40 for Q1-19 vs $5.29 for Q1-18.  Implies 39.8% growth.

Lower than normal “operating” margins stay with us.  Looks like an 82.0% margin on “operating” earnings in Q1-19 vs 90.6% in Q1-18.  Expenses over the same time peried (implied from data provided in the release) are estimated to be up 192%.

I’m impressed by the figures quoted immediately below.  Production growth marches on!

Oil and gas royalty revenue was $33.2 million for the first quarter ended March 31, 2019, compared with $26.5 million for the first quarter ended March 31, 2018, an increase of 25.1%. Crude oil and gas production subject to the Trust’s royalty interests increased 58.5% and 119.6%, respectively, in the first quarter ended March 31, 2019 compared to the first quarter ended March 31, 2018. While crude oil and gas production increased in the first quarter ended March 31, 2019 compared to March 31, 2018, the prices received for crude oil and gas production decreased 16.7% and 46.7%, respectively, over the same time period.

q1 vs q1

margin

The last column in the exhibit above should read 1Q19.

4Q Margin Compression

rude and crude

Rude and crude analysis warning.  I was looking at 4Q and was thinking that net income looked fairly light relative to revenue so I did a little digging and confirmed my suspicion.

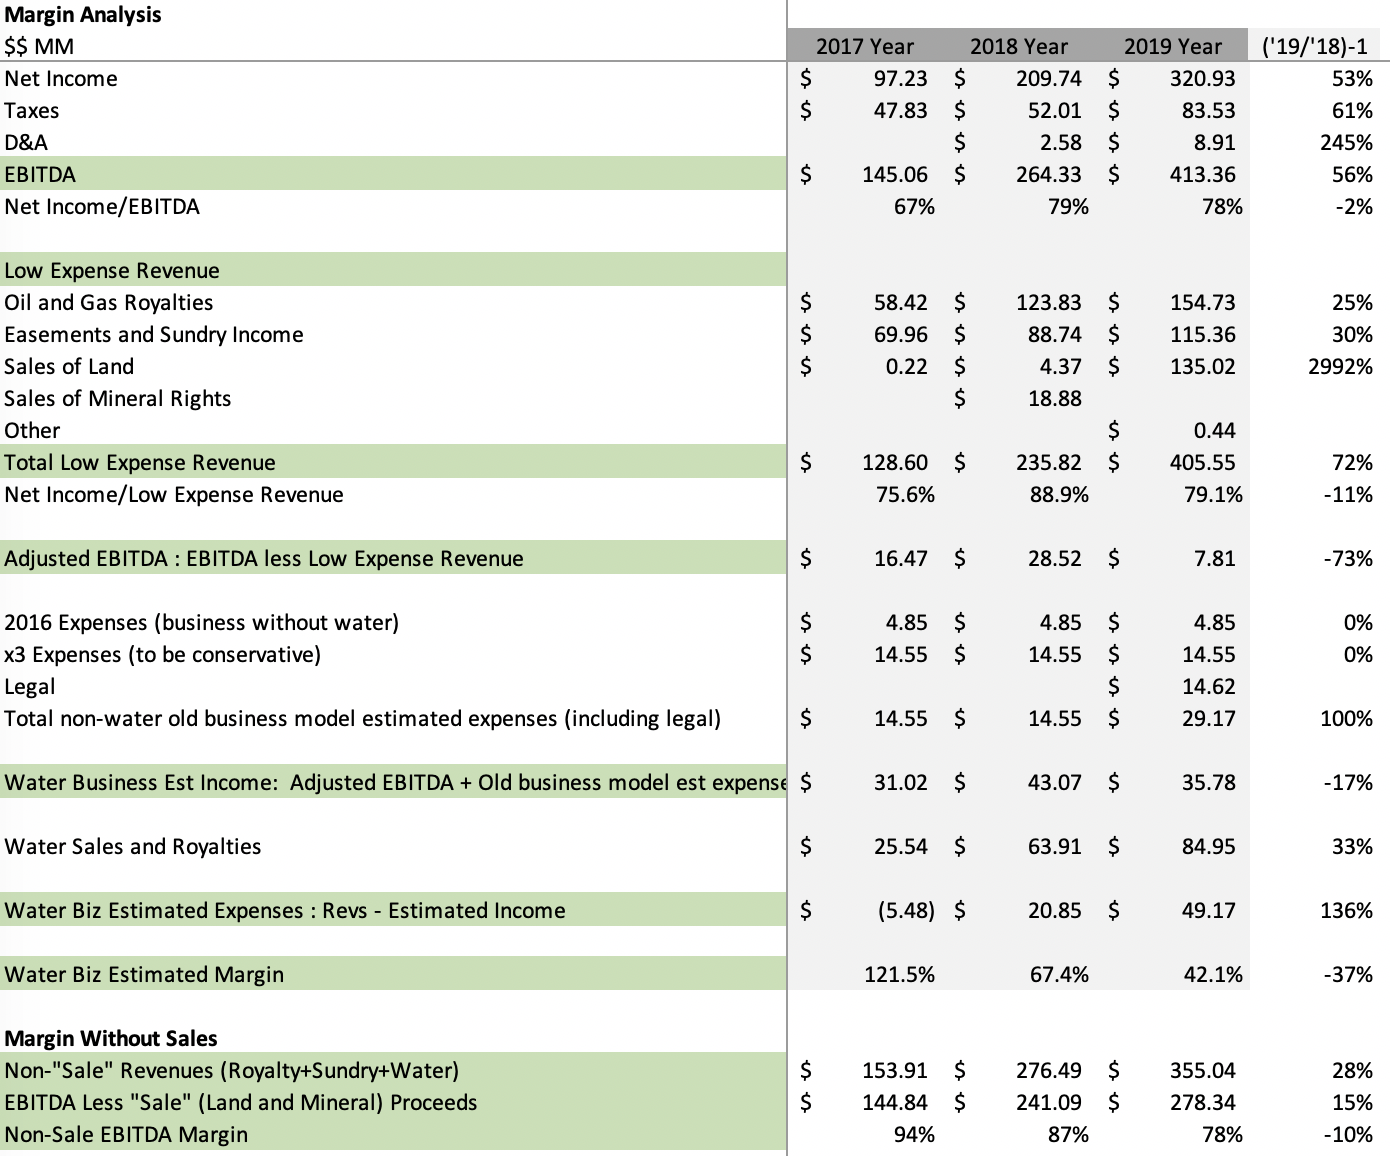
The top analysis attempts to isolate the water business to determine profitability.  We start with net income and add taxes back in to get an EBT.  EBT is then reduced by TPL’s legacy “low expense” businesses (Royalty, Sundry, and Sales) to get towards earnings from the water business.  This new adjusted EBT number is further adjusted by adding back an estimate for the expenses (2x 2016 full year expenses) of the “low expense” businesses.  The result is something that might approximate income generated by the Water business.  Water’s reported top line can be compared to the water income estimate to get a picture of what Water’s expenses and margin look like.

The conclusion is that Water’s expenses were up significantly in 4Q which drove the estimated margin down to ~21%.  Lots of assumptions and brute force in here.  Everything highlighted in green is a custom creation.

The bottom analysis gets to ongoing margins more directly.  Here we compile the revenues from Royalty, Sundry, and Water and compare them to a “non-sale” income number that is generated by adding taxes and proceeds from asset sales back into net income.  Adjusted income / adjusted sales = margin of repeating buiness.  This analysis too points to materially lower margins in 4Q.

Where’s that margin going?

Update:  Quick update 15 minutes after posting.  Please take some time to look at the column all the way to the right.  Margin compression or not, $TPL is on fire.  Oh, and thank you Mr. Taxman.