The rows below should be pretty self explanatory. Ultimately I wanted to get to earnings adjusted for asset sales. “Operating” after tax EPS is calculated to be $7.40 for Q1-19 vs $5.29 for Q1-18. Implies 39.8% growth.
Lower than normal “operating” margins stay with us. Looks like an 82.0% margin on “operating” earnings in Q1-19 vs 90.6% in Q1-18. Expenses over the same time peried (implied from data provided in the release) are estimated to be up 192%.
I’m impressed by the figures quoted immediately below. Production growth marches on!
Oil and gas royalty revenue was $33.2 million for the first quarter ended March 31, 2019, compared with $26.5 million for the first quarter ended March 31, 2018, an increase of 25.1%. Crude oil and gas production subject to the Trust’s royalty interests increased 58.5% and 119.6%, respectively, in the first quarter ended March 31, 2019 compared to the first quarter ended March 31, 2018. While crude oil and gas production increased in the first quarter ended March 31, 2019 compared to March 31, 2018, the prices received for crude oil and gas production decreased 16.7% and 46.7%, respectively, over the same time period.
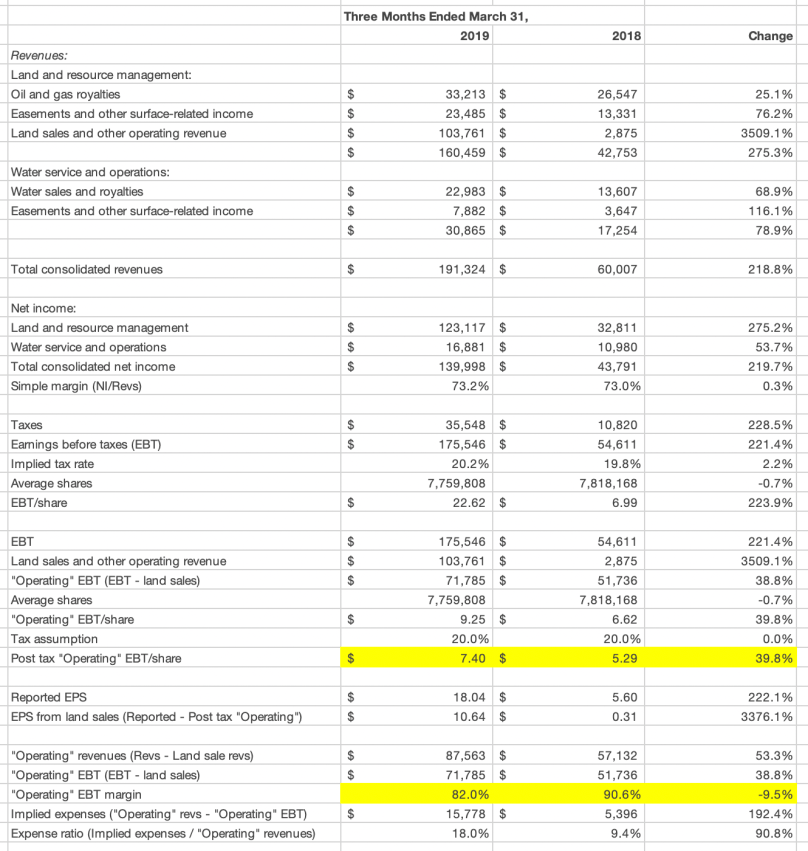

The last column in the exhibit above should read 1Q19.


